Revenue growth · decision science · public case study
Next Best Offer
for travel ancillaries
Which three eligible products belong in each customer's campaign? This case turns calibrated purchase probabilities into a commercial Top-3 policy, then tests it against frozen popular, rule-based and expected-value baselines.
Frozen v1.0.075,000 synthetic customersUntouched chronological testNo live model
01 · Decision outcome
More simulated margin.
Not a universal ranking win.
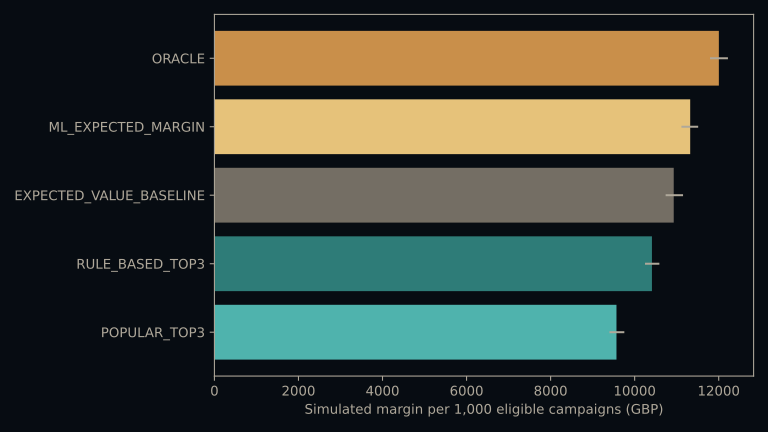
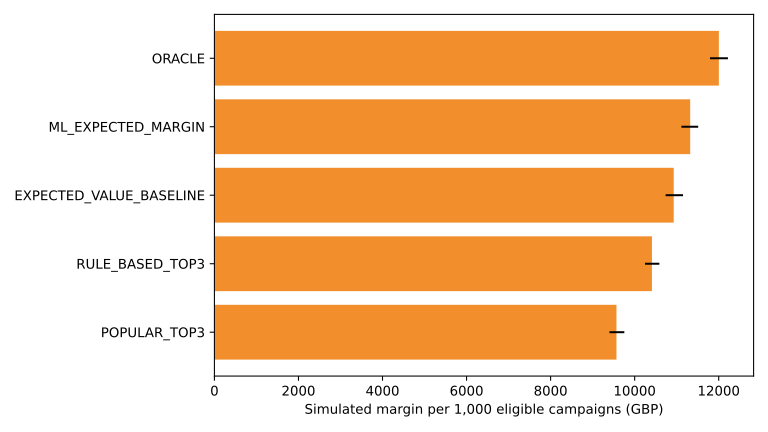
The model beat both commercial baselines on mean margin, but Global Popular Top-3 remained stronger on NDCG@3. Under the criteria frozen before tuning, that is Outcome C—not a retrofitted success label.
All six figures are loaded from results.json, the same frozen artefact published on Kaggle and GitHub.
02 · The business problem
Eligible candidates
Generate every ancillary the booking can actually buy.
Calibrated propensity
Estimate purchase probability without using hidden simulator truth.
Expected margin
Multiply calibrated probability by the currently available margin.
Commercial Top-3
Rank eligible offers and return three campaign decisions.
Frozen before tuning
The simulator, chronological split, baselines, success criteria and 100 Monte Carlo seeds were documented before the final test run.
Selective labels respected
Training uses only mature outcomes for historically shown offers. Time-safe history is built before each recommendation timestamp.
Value needs calibration
Isotonic calibration was chosen on validation data because probabilities are multiplied by product margin.
Truth stays restricted
Latent probabilities are excluded from model features and the public dataset. They enter only the final policy replay and unattainable oracle.
03 · Evidence
Three views of the decision.
Each chart is a presentation-styled SVG derived from the frozen Kaggle export; values and geometry are unchanged. The source CSV and original SVG remain linked below.
Relevance
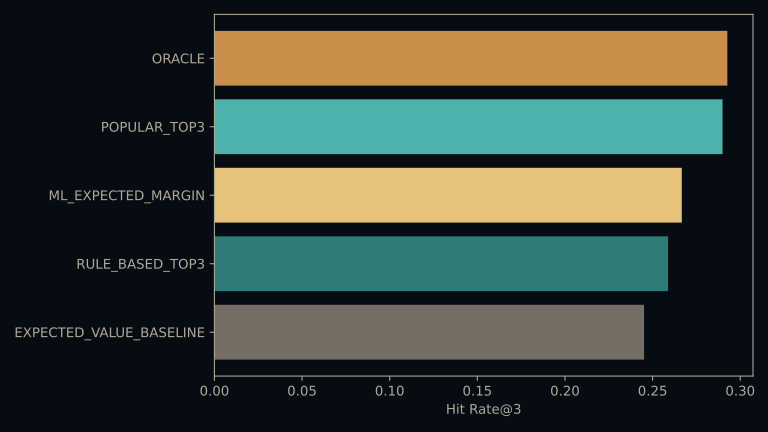
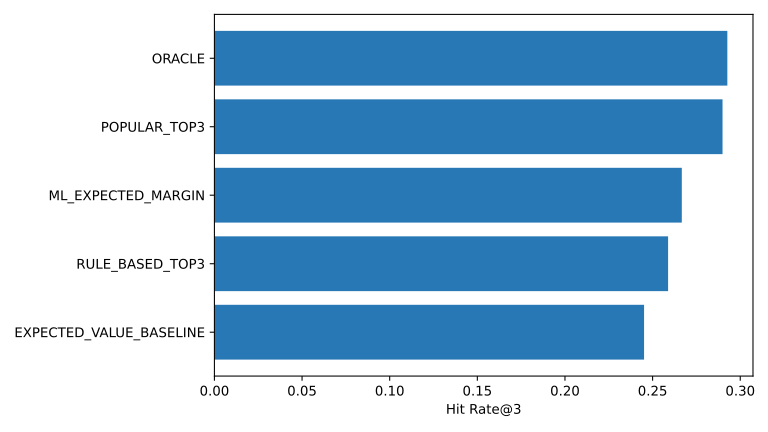
Hit Rate@3 versus baselines
Popular products remain difficult to beat on unweighted relevance.
Commercial value
Margin per 1,000 eligible campaigns
Mean policy value with 95% simulation intervals across 100 fixed seeds.
Responsible feature choice
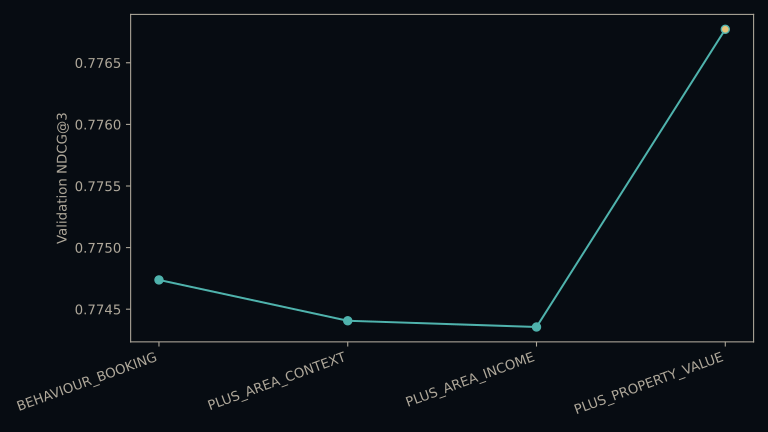
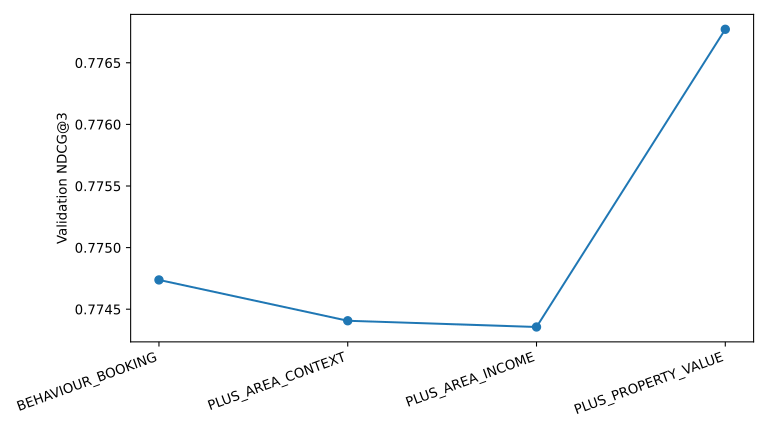
Area-feature ablation
Property value added a small validation signal; it is treated as removable context, not an individual wealth proxy.
04 · Test-set examples
What the email would contain.
Actual records from the synthetic test set, selected under a pre-declared rule—not hand-crafted personas and not a live demo.
Loading frozen examples…
05 · Claim boundary
Evidence, not theatre.
This project demonstrates model selection and policy behaviour under a documented synthetic simulator. It does not establish causal uplift in a real travel population. Production adoption would require randomised exploration, an A/B test, operational constraints and responsible-use monitoring.
Decision systems for growth